Charlotte Capital Connection 2026
Registration & Engagement Report
1 Overview
This report provides an analysis of event registration data collected through Qualtrics, focusing on registrant demographics, university affiliations, academic program representation, employer participation, and event selection patterns. The analysis examines both individual registrations and employer-level engagement to provide insight into the composition and reach of the event.
Registration records were cleaned, validated, deduplicated, and standardized to support consistent reporting. The resulting datasets form the basis for the visualizations, summaries, and findings presented throughout this report.
The objective of this report is to provide a comprehensive understanding of event registration and engagement patterns, identify opportunities for continued alumni and employer outreach, and establish a reliable foundation for future engagement analysis.
Due to inconsistencies and potential inaccuracies in attendance tracking, this analysis is based exclusively on registration data rather than verified attendance records. Consequently, the findings reflect registration patterns and intended participation and may not accurately represent actual event attendance.
1.1 Data Dictionary
Guest Registrations: Contains registration data for respondents identified as alumni, current students, and employer partners.
| Variable | Type | Description |
|---|---|---|
first_name |
Character | Registrant’s first name |
last_name |
Character | Registrant’s last name |
employer |
Character | Current or most recent employer |
job_title |
Character | Current or most recent job title |
email |
Character | Unique registrant email address |
ut_affiliation |
Categorical | Relationship with UT |
grad_year |
Integer | Reported graduation year |
programs |
Categorical | Graduate program affiliation |
haslam_undergrad |
Logical | Haslam undergraduate affiliation |
events |
Categorical | Selected event registration |
The ut_affiliation variable include levels of alumni, representing individuals who identified as an undergraduate or graduate program alumnus, alumni_employer_partner, representing alumni who are also employer partners, alumni_current_student, representing alumni who are currently enrolled in a graduate program, current_student, representing individuals currently enrolled at UTK at either the undergraduate or graduate level, and employer_partner representing employer partners without alumni affiliation.
The haslam_undergrad variable is an indicator of whether a registrant attended Haslam as an undergraduate. A value of TRUE indicates undergraduate attendance at Haslam, while FALSE indicates that the registrant attended only a graduate program or never attended UTK.
The events variable identifies the event(s) a registrant selected. The category both indicates registration for both events. The levels of Networking Reception and Fireside Chat indicate the individual registered exclusively for the respective event.
Employer Summary Contains employer level registration counts by event selection, summarizing employer representation across events.
| Variable | Type | Description |
|---|---|---|
employer |
Character | Standardized employer name |
both |
Integer | Number of registrants associated with the employer who registered for both events |
networking_only |
Integer | Number of registrants associated with the employer who registered for the networking reception only |
fireside_chat_only |
Integer | Number of registrants associated with the employer who registered for the fireside chat only |
Faculty & Staff Registrations Provides faculty/staff response data.
| Variable | Type | Description |
|---|---|---|
first_name |
Character | Faculty or staff member’s first name |
last_name |
Character | Faculty or staff member’s last name |
job_title |
Character | Current or most recent job title |
email |
Character | UTK email address |
events |
Categorical | Selected event registration |
The events variable identifies the event(s) a registrant selected. The category both indicates registration for both events. The levels of Networking Reception and Fireside Chat indicate the individual registered exclusively for the respective event.
1.2 Data Cleaning and Validation Process
Registration data were extracted from Qualtrics and cleaned, validated, and standardized to improve data quality, consistency, and reliability. The preparation process included the following procedures:
- Initial Data Validation: Removed the additional Qualtrics header row, renamed variables for clarity, and verified the uniqueness of survey response identifiers.
- Incomplete Response Removal: Identified five incomplete survey responses and investigated whether those individuals subsequently submitted completed registrations. Four incomplete respondents were identified, three of whom had completed responses. All five incomplete responses were excluded from the final dataset.
- Duplicate Registration Resolution: Identified duplicate registrations by first and last name, compared responses for inconsistencies, and retained the most recent completed response for each individual. This resulted in 107 unique registration records before separating faculty and staff.
- Variable Selection and Formatting: Removed unnecessary survey fields, corrected excess whitespace, standardized name capitalization, and converted email addresses to lowercase.
- Employer Standardization: Consolidated inconsistent employer names, abbreviations, spelling variations, and organizational references. For example, variations of the University of Tennessee and Haslam College of Business were standardized to UTK to prevent duplicate employer classifications.
- UT Affiliation Standardization: Recoded university affiliations into consistent categories, distinguishing alumni, current students, employer partners, and individuals with multiple affiliations. Faculty and staff registrations were separated into an independent dataset.
- Academic Program Standardization: Standardized graduate program names and abbreviations, consolidated program information from multiple survey fields, and excluded undergraduate-only program classifications from graduate program reporting. A Boolean variable, haslam_undergrad, was created to preserve undergraduate affiliation information.
- Event Registration Standardization: Converted lengthy survey responses into three standardized categories: Both, Networking Reception, and Fireside Chat. Registrations indicating participation in both events were distinguished from those selecting only one event.
- Employer-Level Aggregation: Aggregated individual registration records by standardized employer name to calculate the number of registrants selecting both events, the networking reception only, or the fireside chat only.
- Final Dataset Preparation: Exported three cleaned datasets: guest_registration.csv, containing individual guest registrations; faculty_staff_registration.csv, containing faculty and staff registrations; and employer_registration_counts.csv, containing employer-level registration summaries.
The cleaning process addressed incomplete responses, duplicate submissions, inconsistent categorical values, and variations in employer and academic program names. The final datasets provide a standardized foundation for analyzing registration patterns, university affiliations, graduate program representation, and employer engagement.
2 Registrant Characteristics
2.1 UT Affiliation
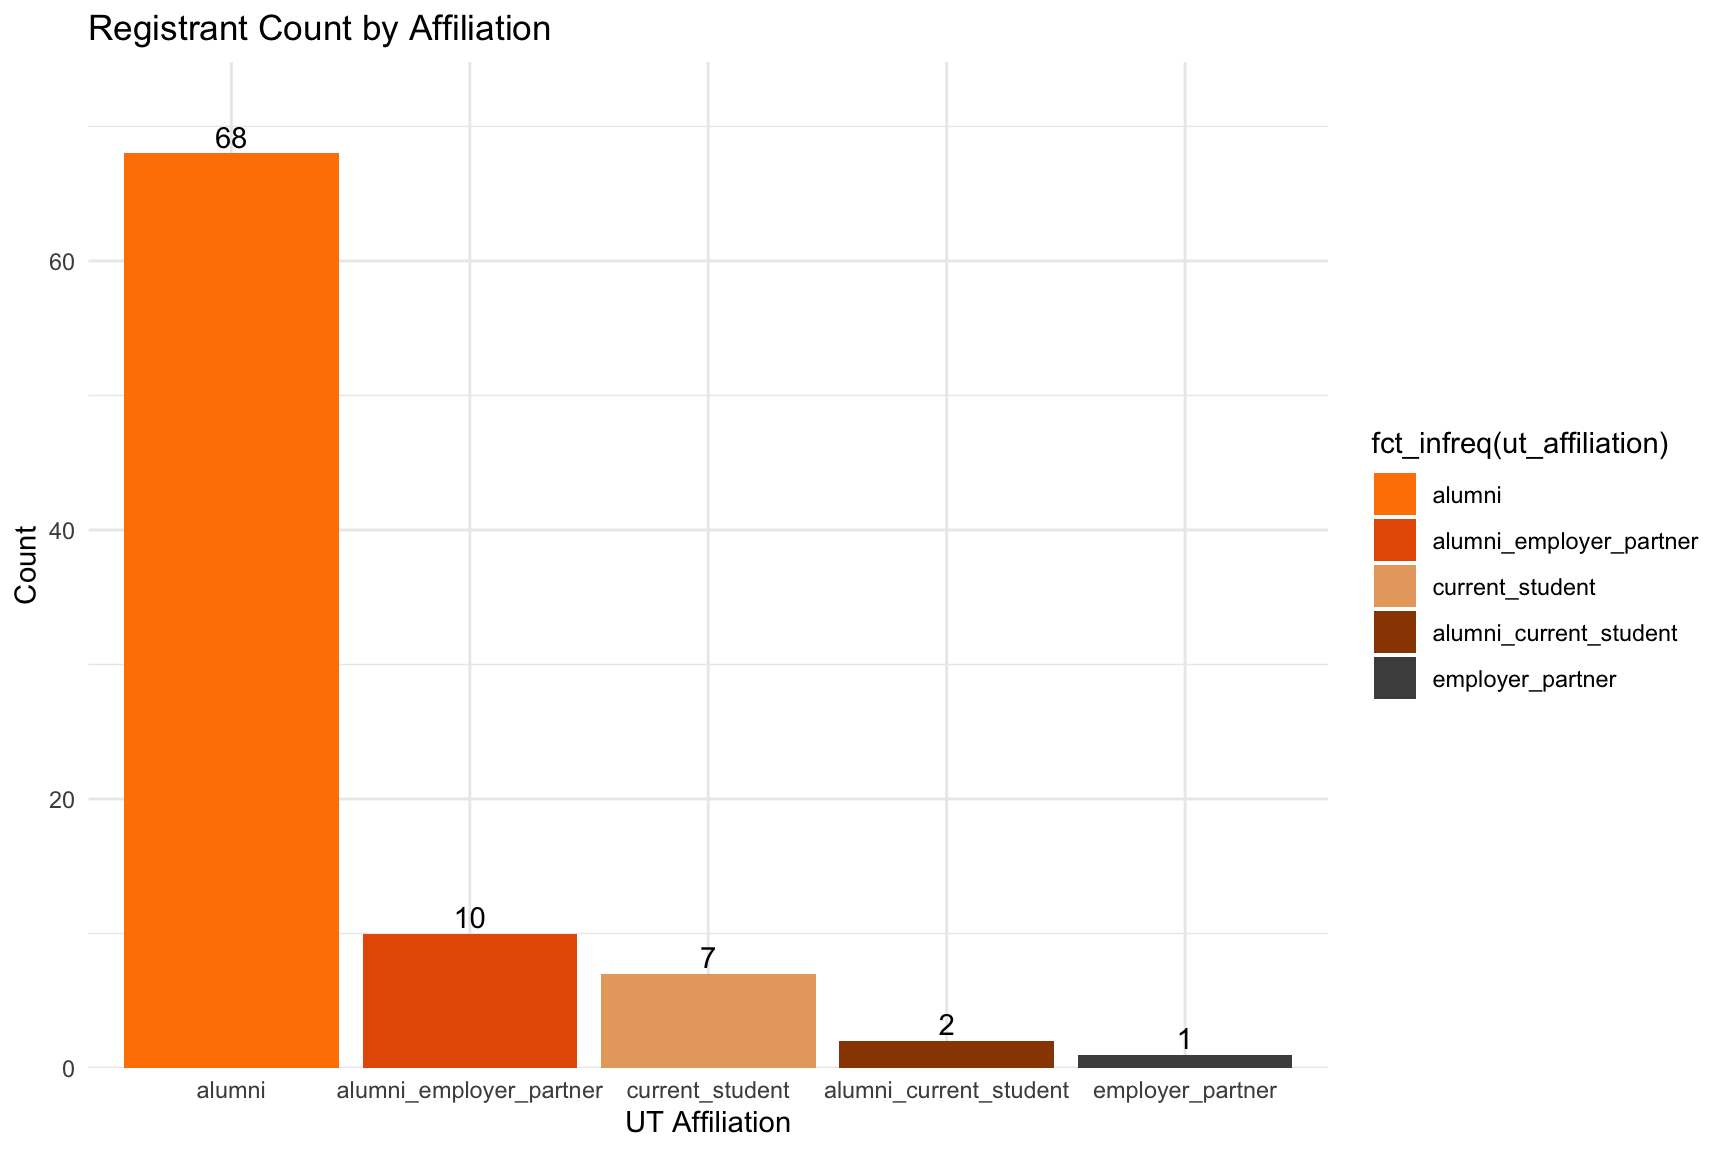
Alumni represent the largest group, accounting for 68 of the 88 guest registrants (77.3%), followed by alumni who are also employer partners (10; 11.4%) and current students (7; 8.0%). Alumni who are also current students account for two registrations (2.3%), while non-alumni employer partners account for one (1.1%).
When combining all categories that include alumni affiliation, 80 registrants (90.9%) have an alumni connection to UT. This indicates that event registration was heavily concentrated among alumni, with comparatively limited representation from current students and employer partners without alumni affiliation.
Note: These figures exclude the 19 faculty and staff registrants, who are reported separately.
2.2 Graduation Year
| Graduation Decade | Registrants |
|---|---|
| 1980s | 1 |
| 1990s | 7 |
| 2000s | 7 |
| 2010s | 21 |
| 2020s | 40 |
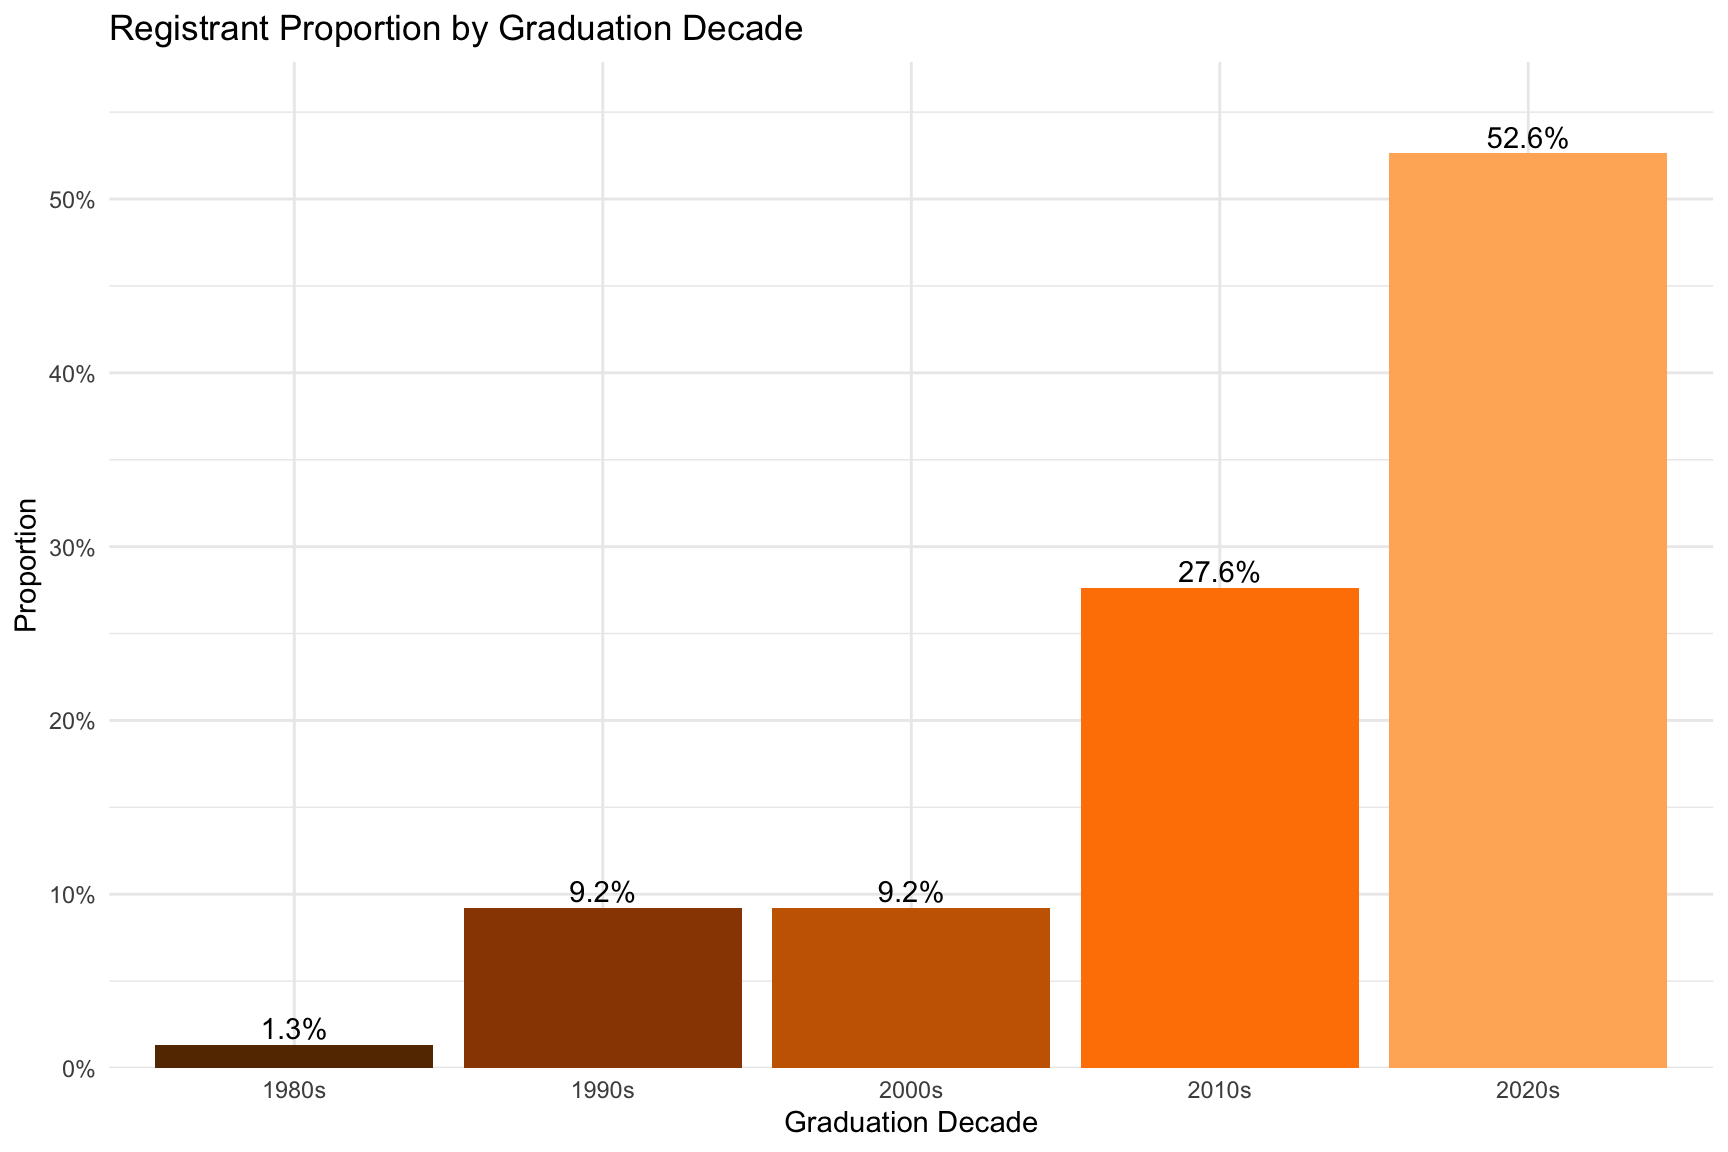
Of the 76 registrants who reported a graduation year, the largest proportion graduated during the 2020s (40; 52.6%), followed by the 2010s (21; 27.6%). Registrants from the 1990s and 2000s each account for 9.2% (7), while one from the 1980s represents 1.3%.
Combined, 80.3% of registrants with a reported graduation year graduated in 2010 or later, indicating that registration was heavily concentrated among more recent graduates, particularly those from the 2020s.
Percentages are calculated using the 76 guest registrants with a reported graduation year. The analysis excludes 12 registrants with missing graduation years, including non-alumni employer partners, as well as the 19 faculty and staff registrants analyzed separately.
2.3 Program
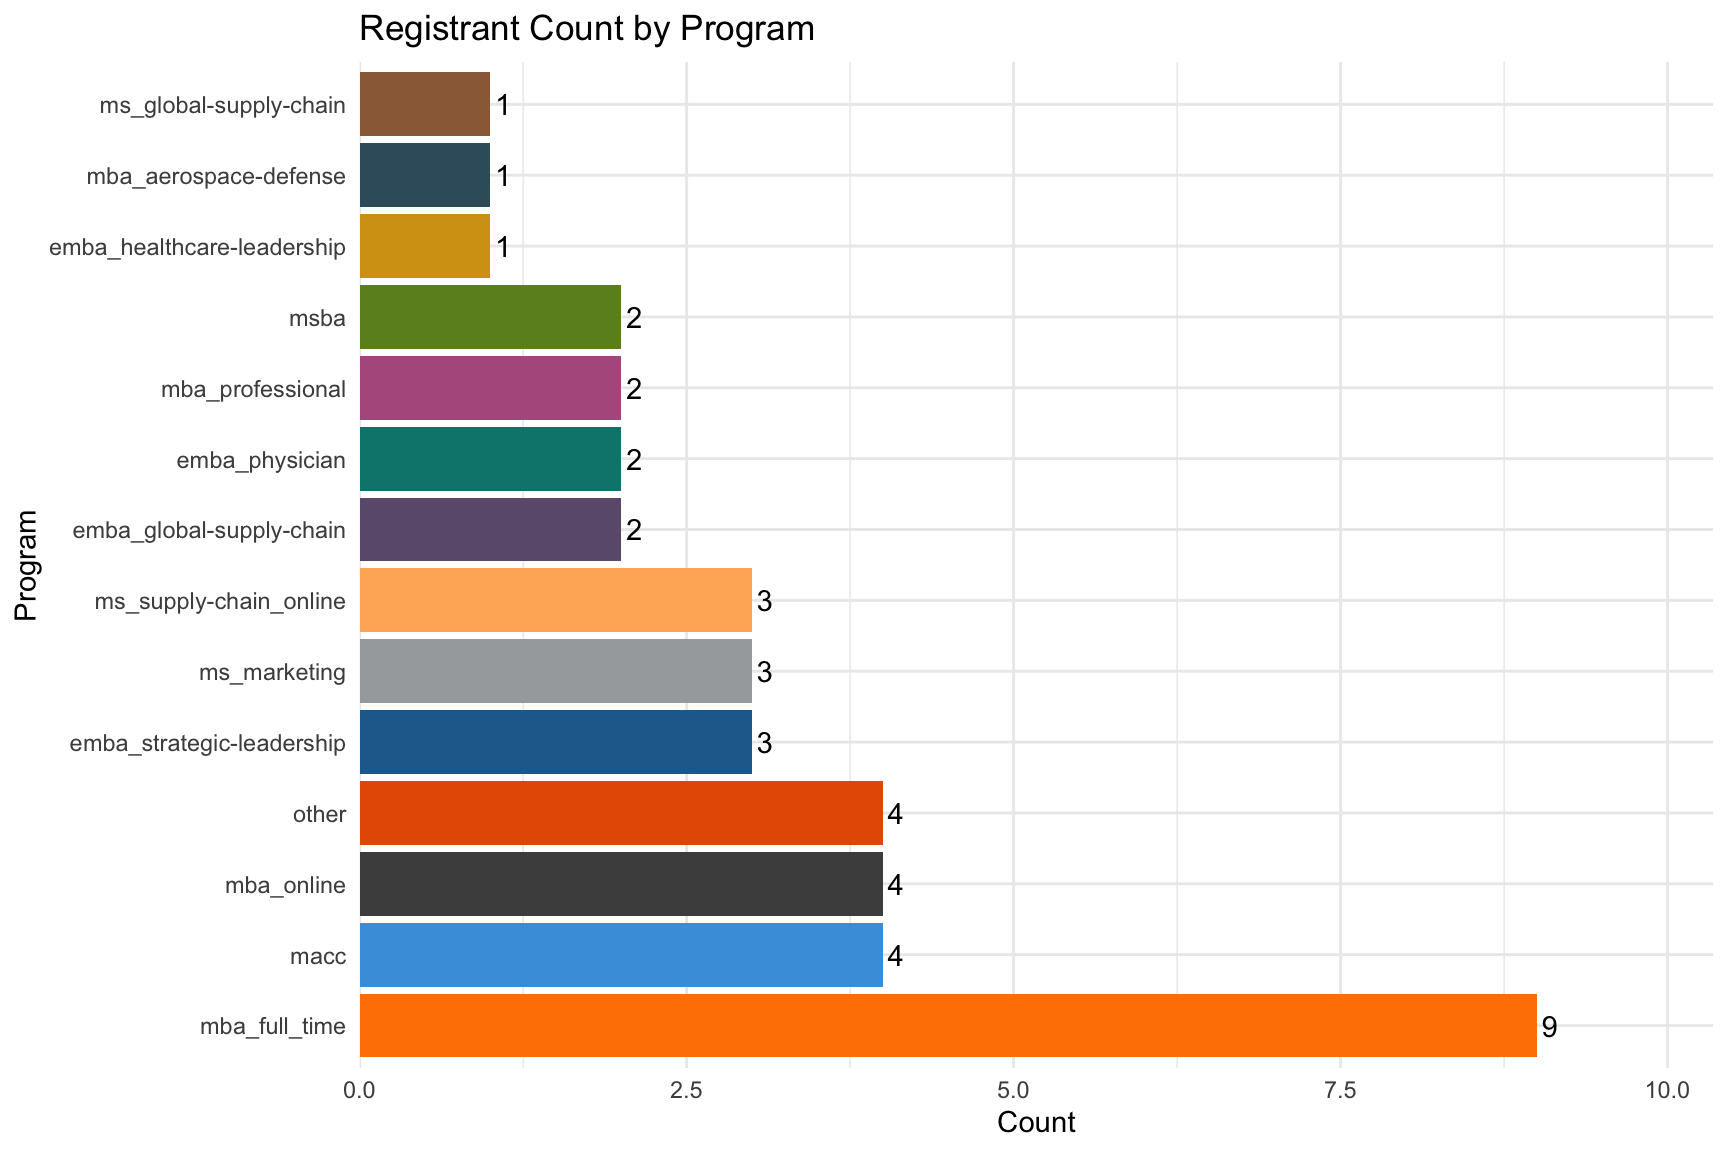
The Full-Time MBA program had the highest representation, with 9 registrants, followed by the Online MBA and Master of Accountancy programs, each with 4 registrants. The Executive MBA for Strategic Leadership, M.S. in Marketing, and Online M.S. in Supply Chain Management programs each accounted for 3 registrants.
Overall, graduate program representation was distributed across a diverse range of academic disciplines, including business administration, supply chain management, marketing, accounting, and business analytics. Although the Full-Time MBA program accounted for the largest individual share, registrations were spread across numerous graduate programs.
This includes 41 guest registrants with an identified graduate program, excluding 47 registrants with missing program information. Undergraduate only affiliations are excluded from graduate program classifications, although Haslam undergraduate attendance is tracked separately. The other category represents graduate program affiliations that were not classified into one of the standardized program categories.
2.4 Undergraduate
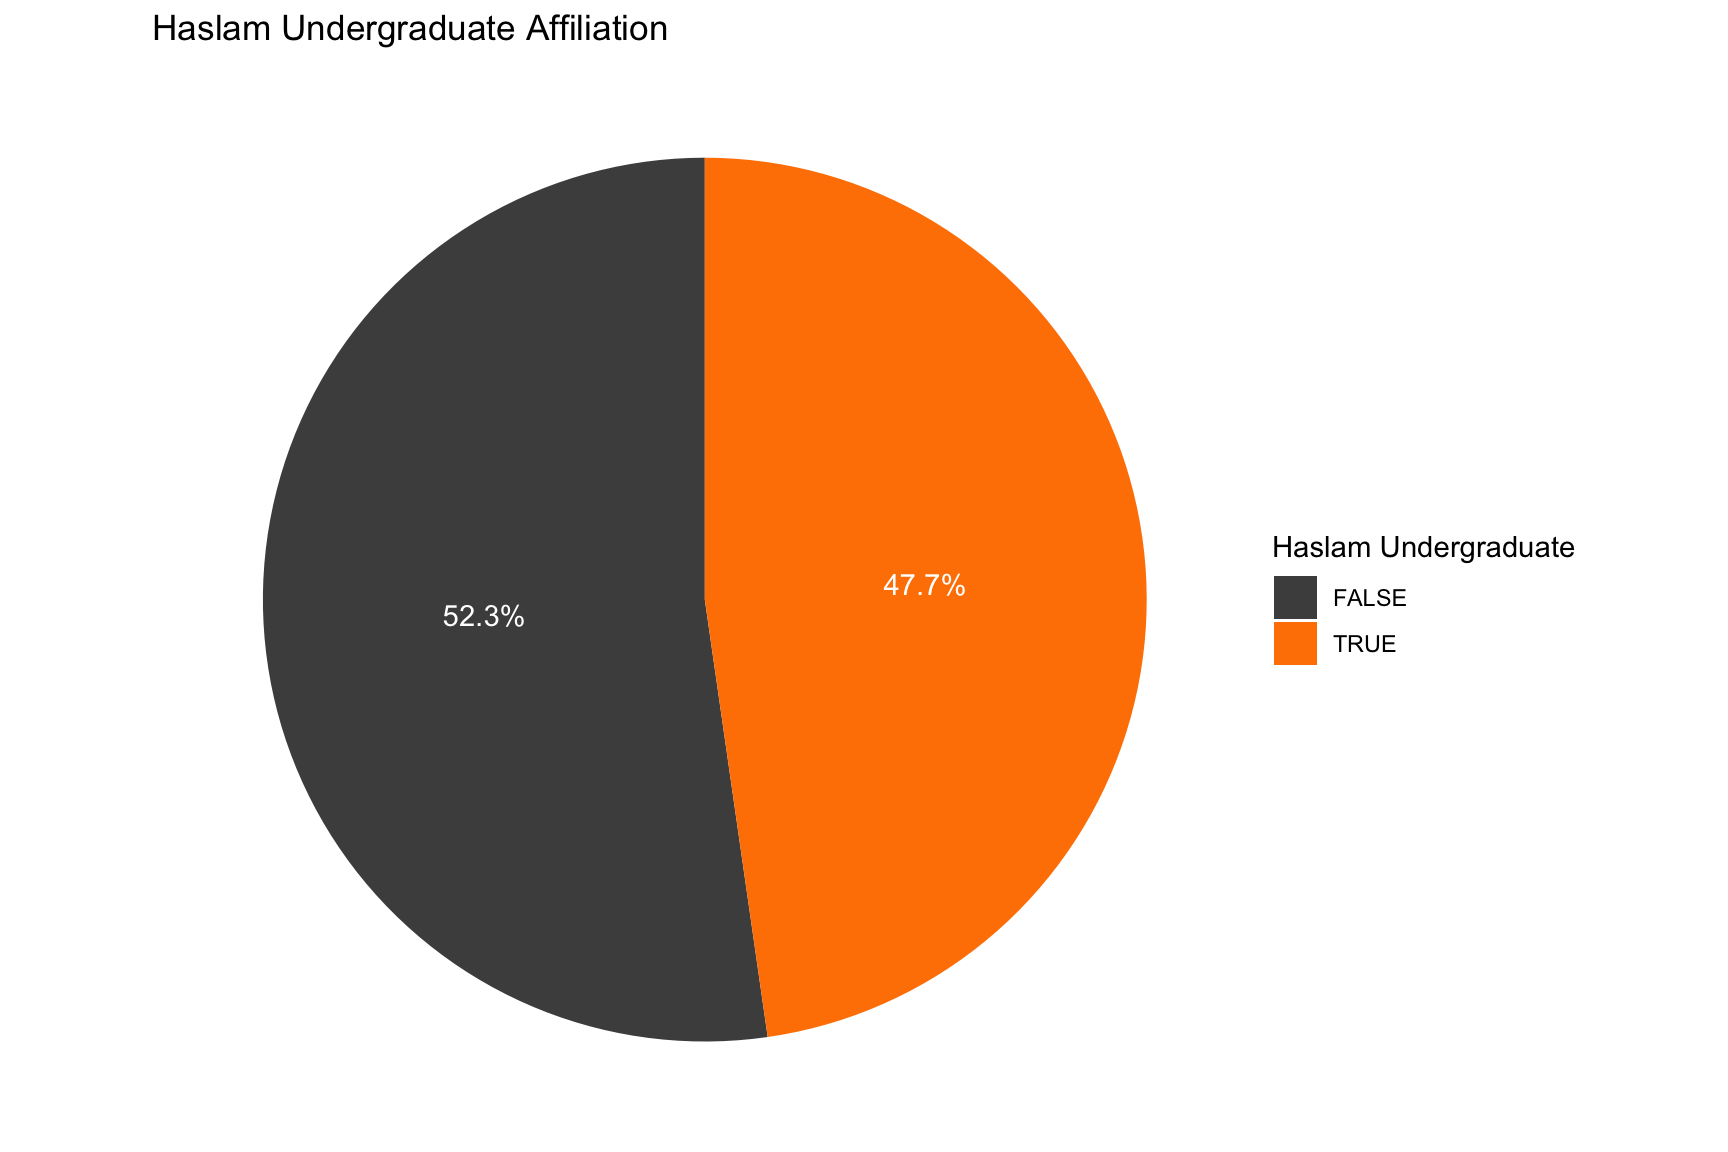
Of the 88 guest registrants, 42 (47.7%) reported a Haslam undergraduate affiliation, while the remaining 46 (52.3%) did not indicate such an affiliation.
Percentages are calculated using all 88 guest registrants, excluding the 19 faculty and staff registrants. A FALSE classification indicates that a Haslam undergraduate affiliation was not identified in the registration data; it does not necessarily confirm that the registrant never attended Haslam as an undergraduate.
3 Event Breakdown
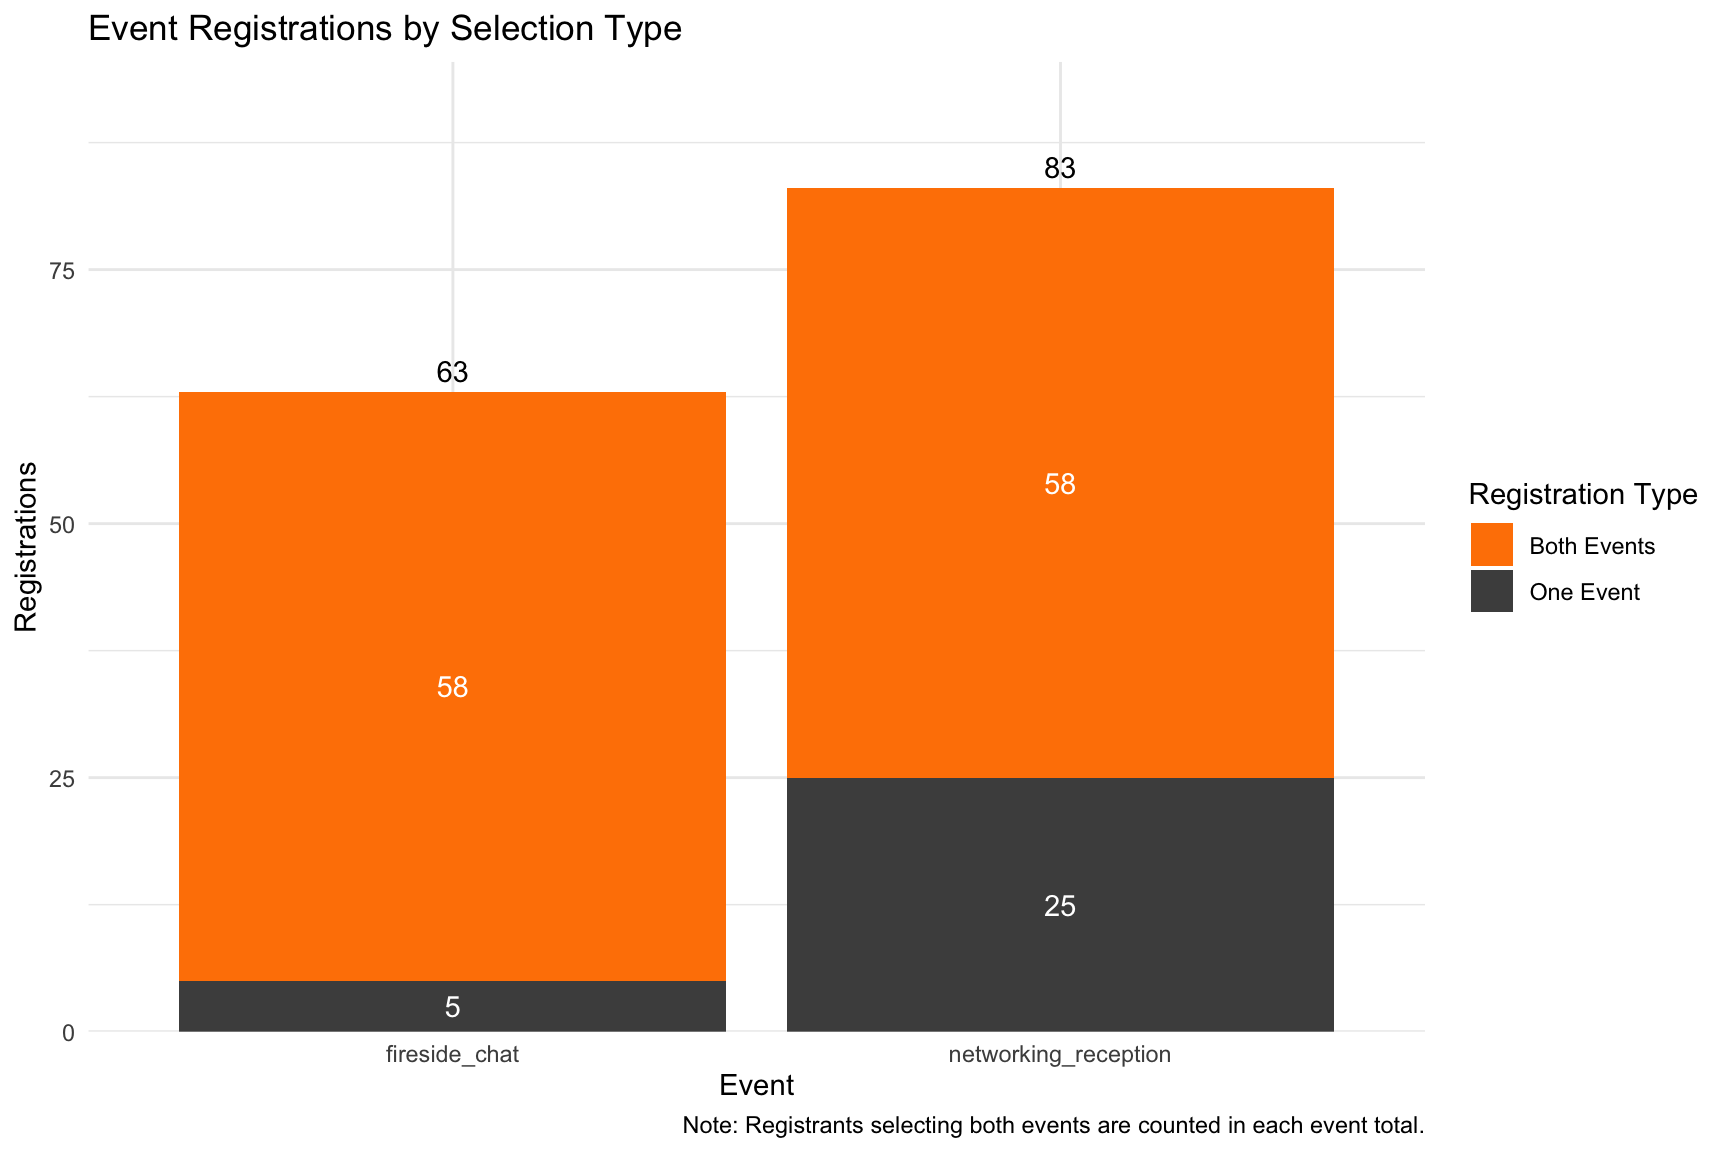
The Networking Reception received the highest number of registrations (83), compared to 63 for the Fireside Chat. Of these, 58 registrants (69.9% of Networking Reception registrations) selected both events, while 25 (30.1%) registered exclusively for the Networking Reception. For the Fireside Chat, 58 registrants (92.1%) selected both events, while only 5 (7.9%) registered exclusively for the Fireside Chat.
Overall, 58 of the 88 guest registrants (65.9%) registered for both events, indicating substantial interest in participating in the full event program.
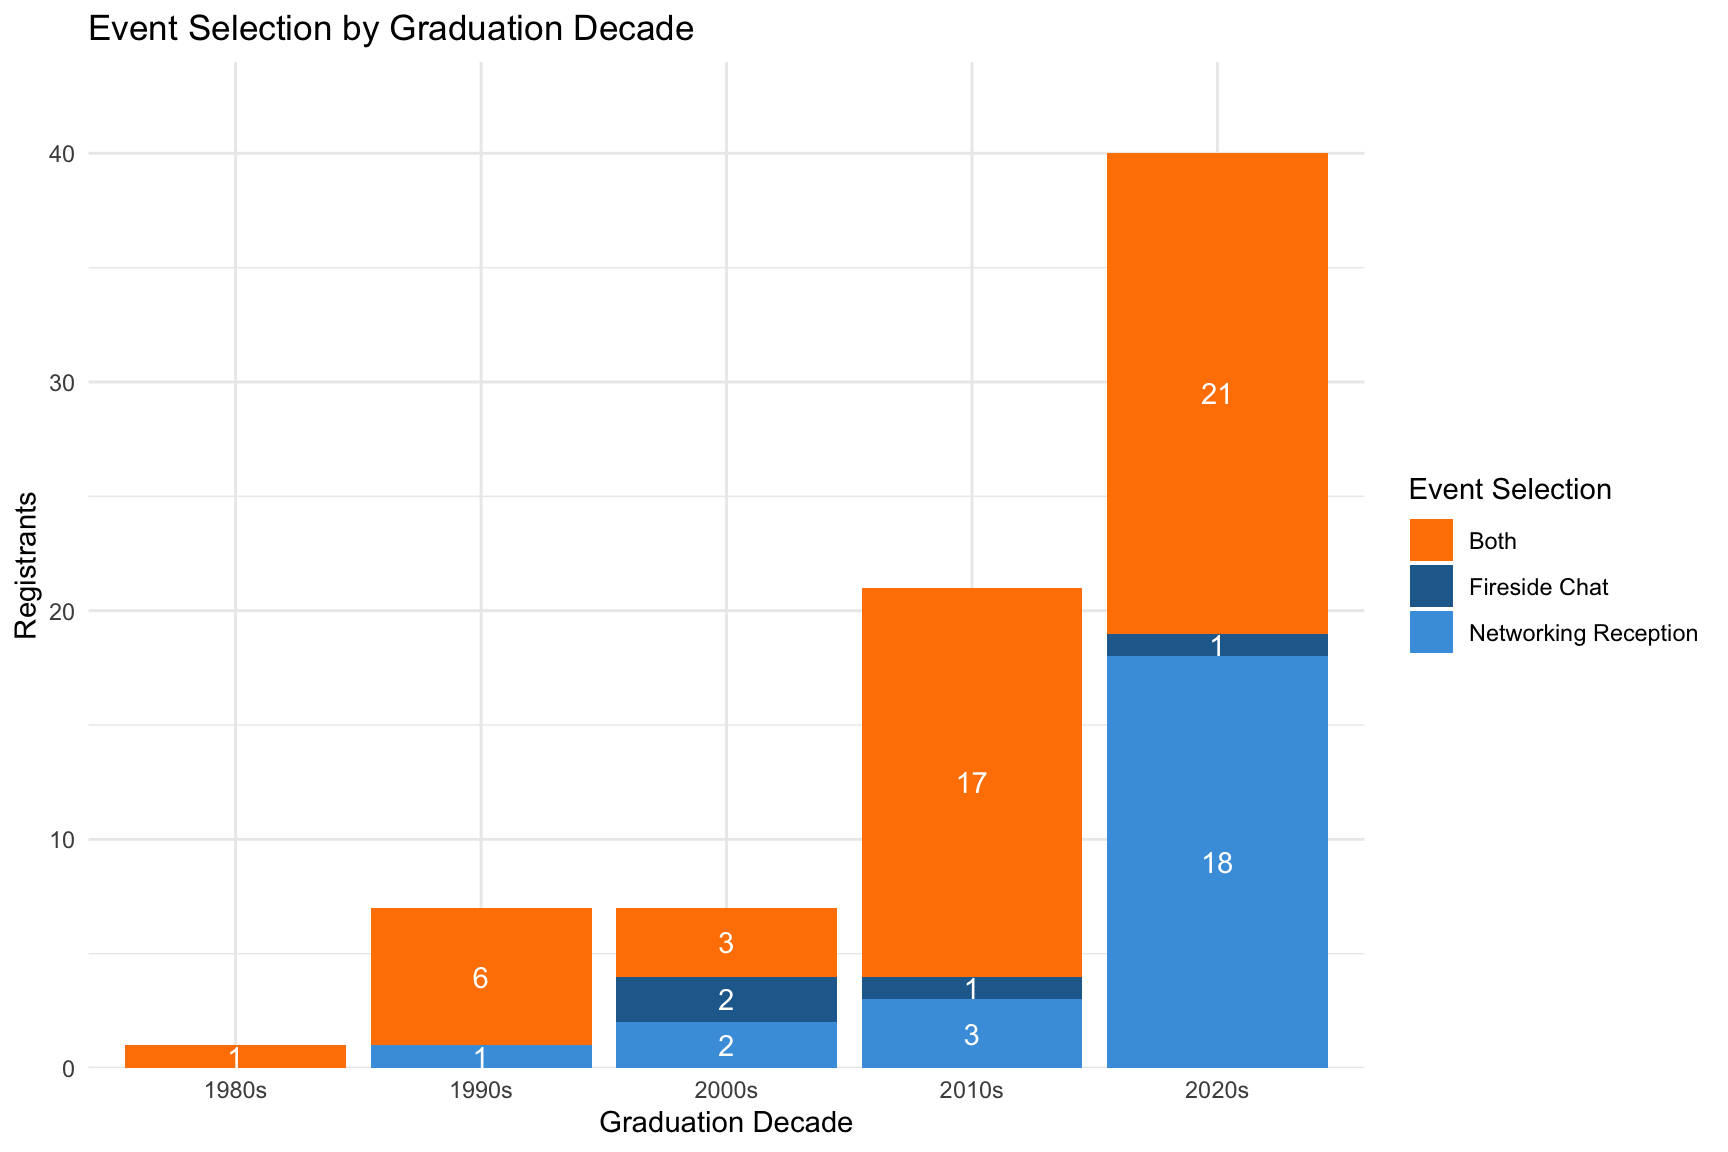
The chart illustrates event registration patterns across graduation decades, distinguishing between registrants who selected both events and those who registered exclusively for the Networking Reception or Fireside Chat.
Graduates from the 2020s represented the largest group, with 40 registrants (52.6%), followed by graduates from the 2010s with 21 (27.6%). Among 2020s graduates, 21 registered for both events, 18 selected only the Networking Reception, and one selected only the Fireside Chat. In contrast, 17 of the 21 registrants from the 2010s (81.0%) selected both events, compared to 52.5% of registrants from the 2020s.
Overall, the patterns suggest that more recent graduates, specifically those from the 2020s, demonstrated a stronger preference for the Networking Reception as a standalone event, while graduates from earlier decades generally favored registering for both events.
4 Employer Representation
4.1 Employer Representation Totals
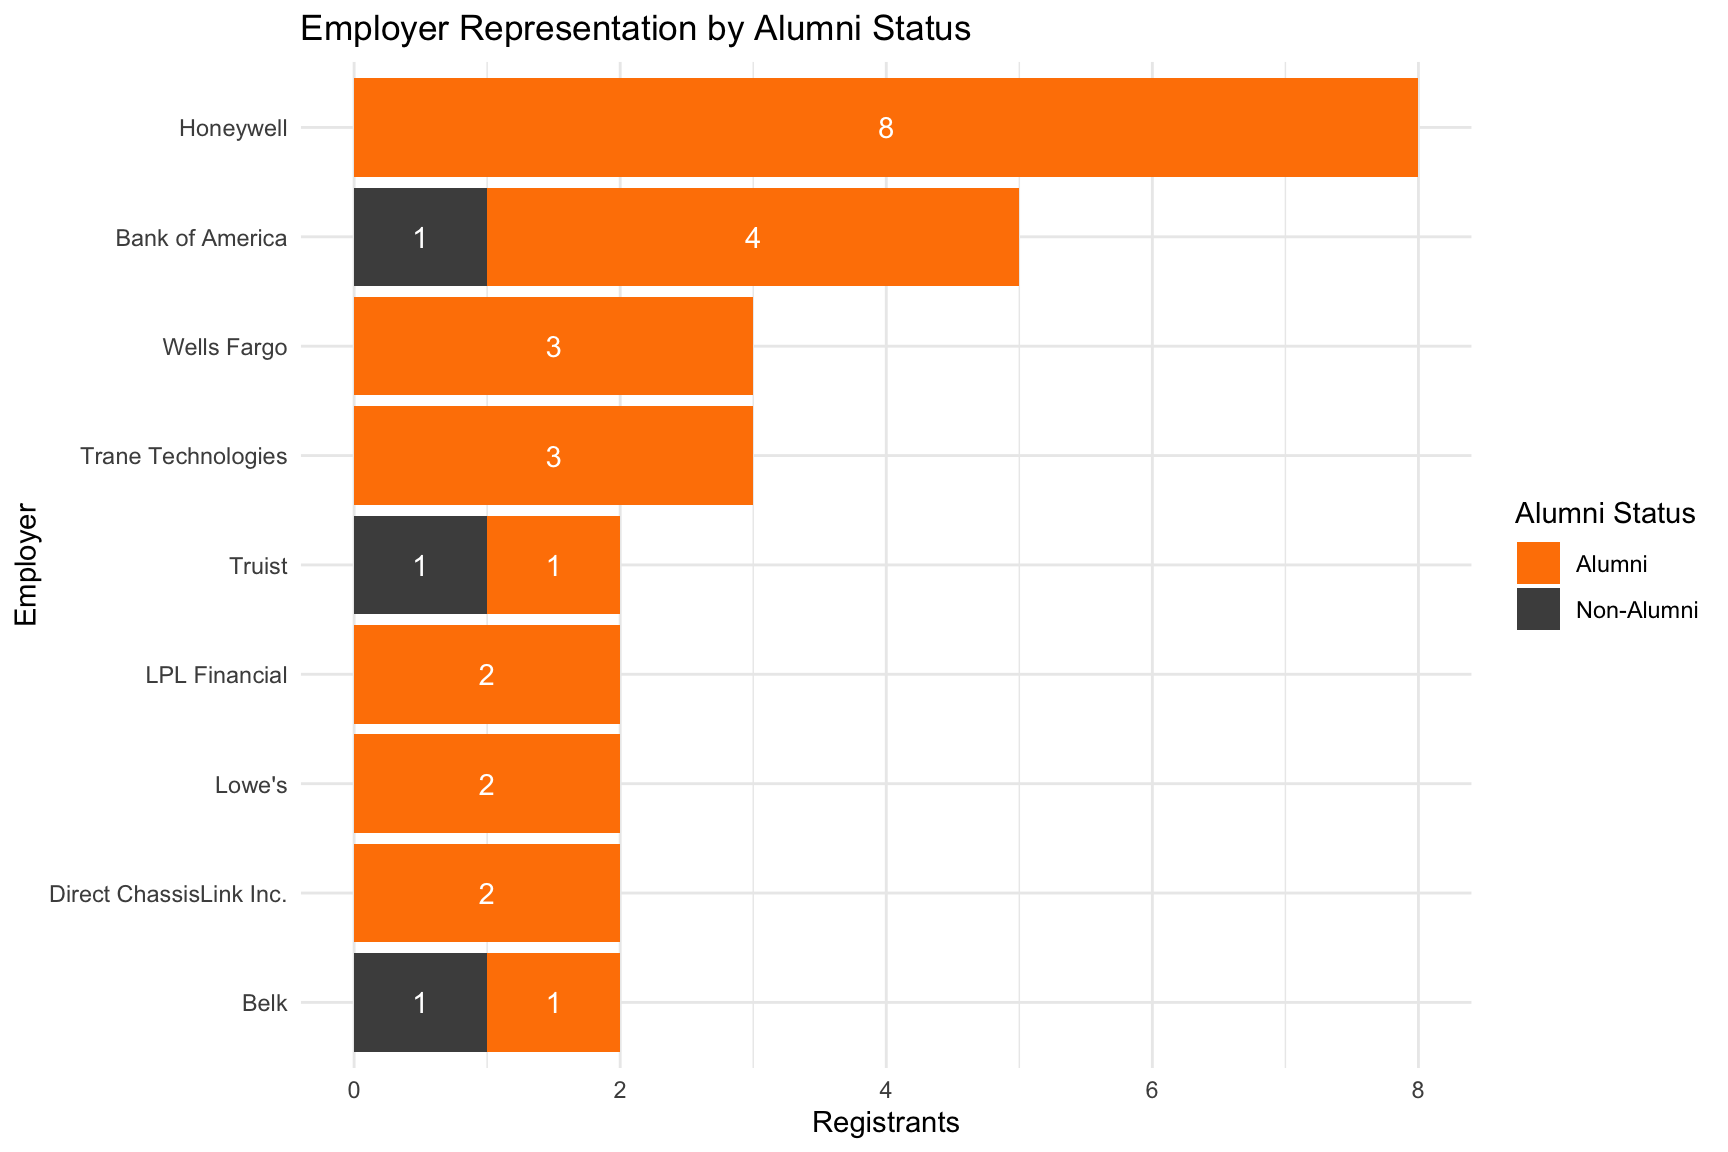
Honeywell demonstrated the highest representation, with 8 registrants, all of whom were UT alumni. Bank of America followed with 5 registrants, including 4 alumni and 1 non-alumnus. Wells Fargo and Trane Technologies each accounted for 3 registrants, all of whom were alumni.
Among the nine employers represented (those associated with two or more registrants), six had exclusively alumni-affiliated registrants, while Bank of America, Truist, and Belk had a combination of alumni and non-alumni registrants. Overall, 26 of the 29 registrants associated with these employers were alumni.
Alumni status includes individuals categorized as alumni, alumni_employer_partner, or alumni_current_student
4.2 Events by Employer
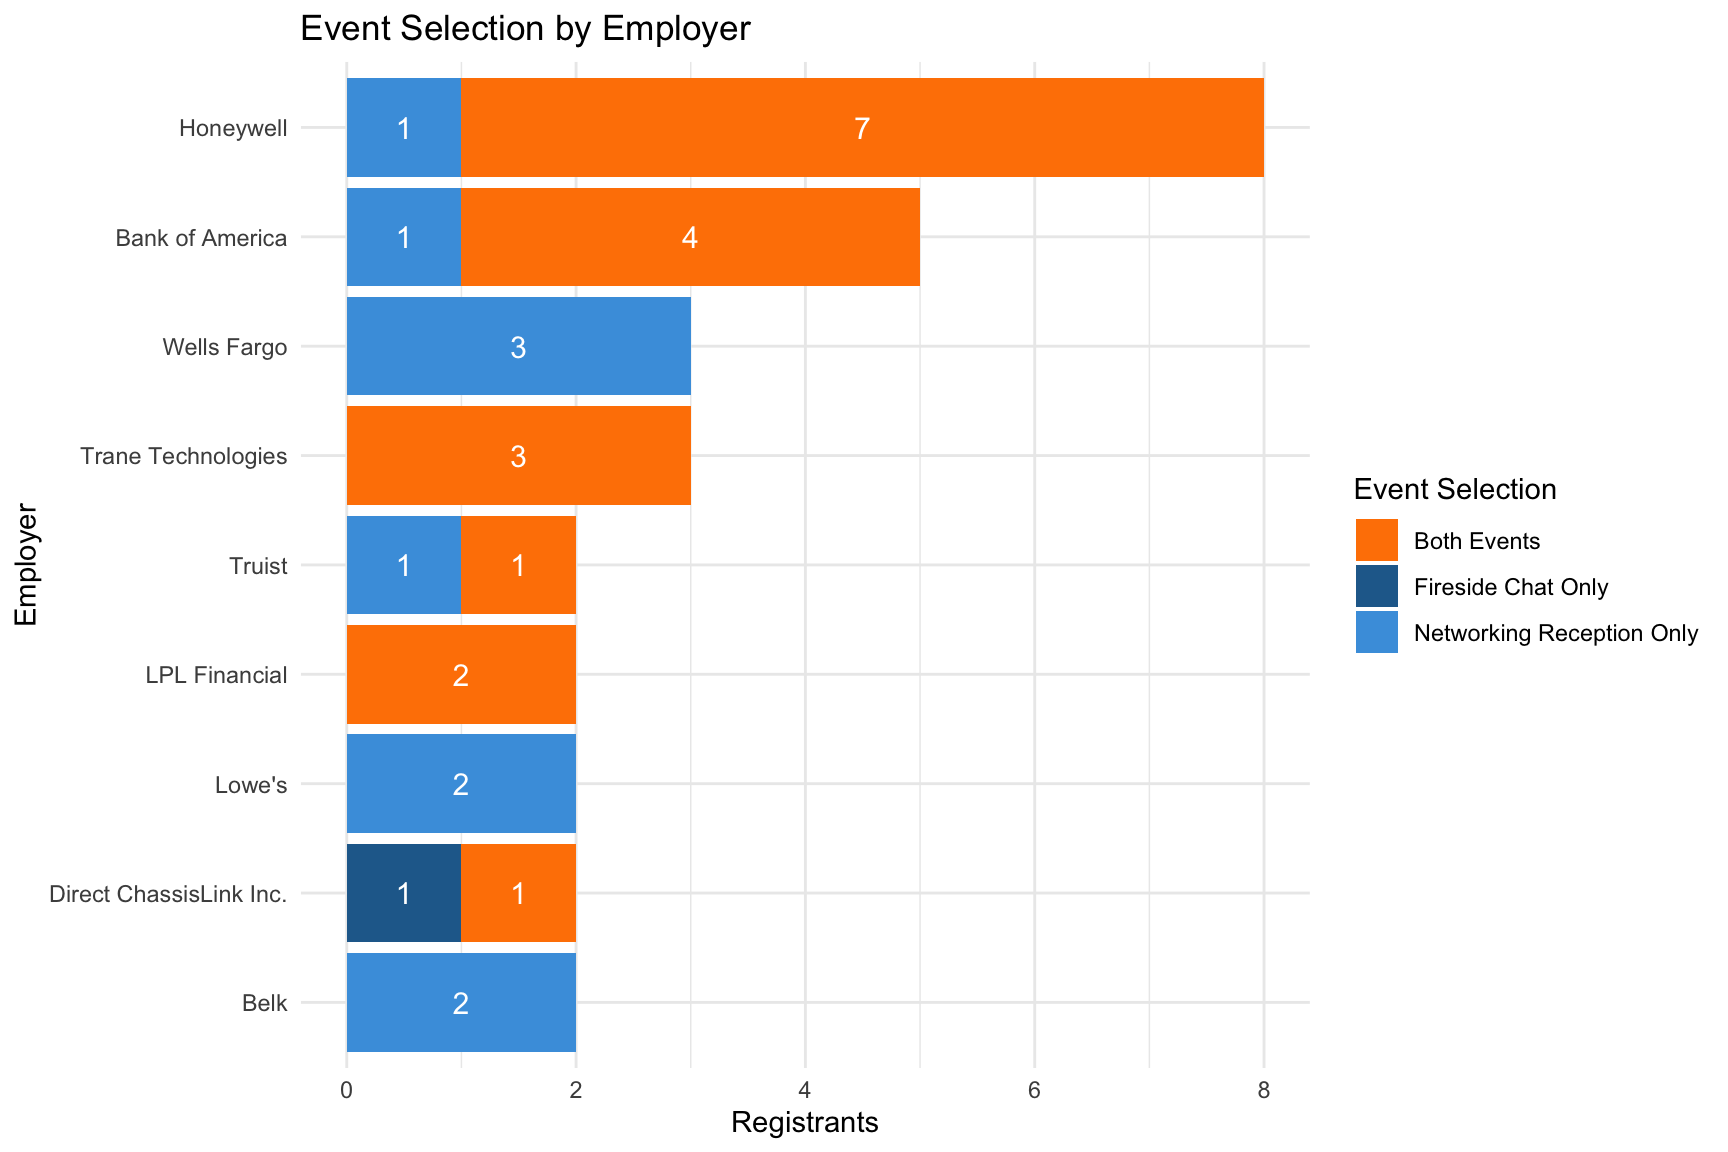
Honeywell demonstrated the highest overall representation, with 8 registrants, including 7 who registered for both events and 1 who selected only the Networking Reception. Bank of America followed with 5 registrants, including 4 who selected both events. Trane Technologies also demonstrated strong interest in both events, with all 3 registrants selecting both.
Registration preferences varied across employers. Wells Fargo, Lowe’s, and Belk had exclusively Networking Reception registrations, while LPL Financial had both registrants select both events. Direct ChassisLink Inc. was the only employer in the analysis with a registrant who selected exclusively the Fireside Chat.
Overall, 18 of the 29 registrants (62.1%) associated with these employers selected both events, while 10 (34.5%) registered exclusively for the Networking Reception and 1 (3.4%) registered exclusively for the Fireside Chat. These findings suggest that combined event registration was the most common selection among employers with multiple registrants, followed by the Networking Reception as a standalone event.
4.3 Industry Representation
Unique employers were classified into the provided industry categories using AI tools (ChatGPT and Codex) to incorporate real world knowledge of each organization’s background. Results are provided below.
Accounting
- EY
- Grant Thornton
- PYA, PC
Consulting Services
- Barrett S. McGrath & Associates LLC
- Deloitte
- Irina Cozma Consulting
Consumer Products
- Artisanal Brewing Ventures
- Nike
- PepsiCo
- Schleich
Energy
- Applied Power Technologies
- Reedy Falls Group
Financial Services
- Bank of America
- CAPTRUST
- Capstone Global Management
- Circle
- F.N.B
- Horizon Investments
- LPL Financial
- North Inlet Advisors
- TowneBank
- Truist
- USAA
- Wells Fargo
Government
- ApprenticeshipNC
- U.S. Army
- US Space Force
Healthcare
- Atrium/Advocate Health
- Bassett Healthcare Network
- CVS Health
- Novant Health
- Pfizer
Hospitality
- RDB Hospitality Group
Manufacturing
- Clayton Homes
- Gamber-Johnson LLC
- Honeywell
- Ingersoll Rand
- MSC Industries
- MacLean Power Systems
- Michelin North America
- Mueller Industries
- Raytheon
- Scout Motors
- Stanley Black & Decker
- Storm Power
- Trane Technologies
- Volvo Group
Media / Entertainment
- Elsevier
Not-For-Profit
- SouthPark Community Partners
Other Services
- Foodbuy USA
- Golding
- Nielsen
- ProBuild of the Carolinas
- USA Farm Labor
Real Estate
- CBRE
- Hillpointe
- JLL
- Keller Williams Southpark
- Stoa Group
Retail
- Belk
- Lowe’s
Technology
- DebtBook
- HP Inc.
- NTT DATA
Transportation and Logistics Services
- BNSF Railway
- Direct ChassisLink Inc.
- Penske Logistics
- Staci Americas- Paxon/Bnode
4.3.1 Registrations by Industry
| Industry | Employers | Registrants | % of Registrants |
|---|---|---|---|
| Manufacturing | 14 | 23 | 26.1% |
| Financial Services | 12 | 20 | 22.7% |
| Healthcare | 5 | 5 | 5.7% |
| Other Services | 5 | 5 | 5.7% |
| Real Estate | 5 | 5 | 5.7% |
| Transportation and Logistics Services | 4 | 5 | 5.7% |
| Consumer Products | 4 | 4 | 4.5% |
| Retail | 2 | 4 | 4.5% |
| Accounting | 3 | 3 | 3.4% |
| Consulting Services | 3 | 3 | 3.4% |
| Government | 3 | 3 | 3.4% |
| Technology | 3 | 3 | 3.4% |
| Energy | 2 | 2 | 2.3% |
| Hospitality | 1 | 1 | 1.1% |
| Media / Entertainment | 1 | 1 | 1.1% |
| Not-For-Profit | 1 | 1 | 1.1% |
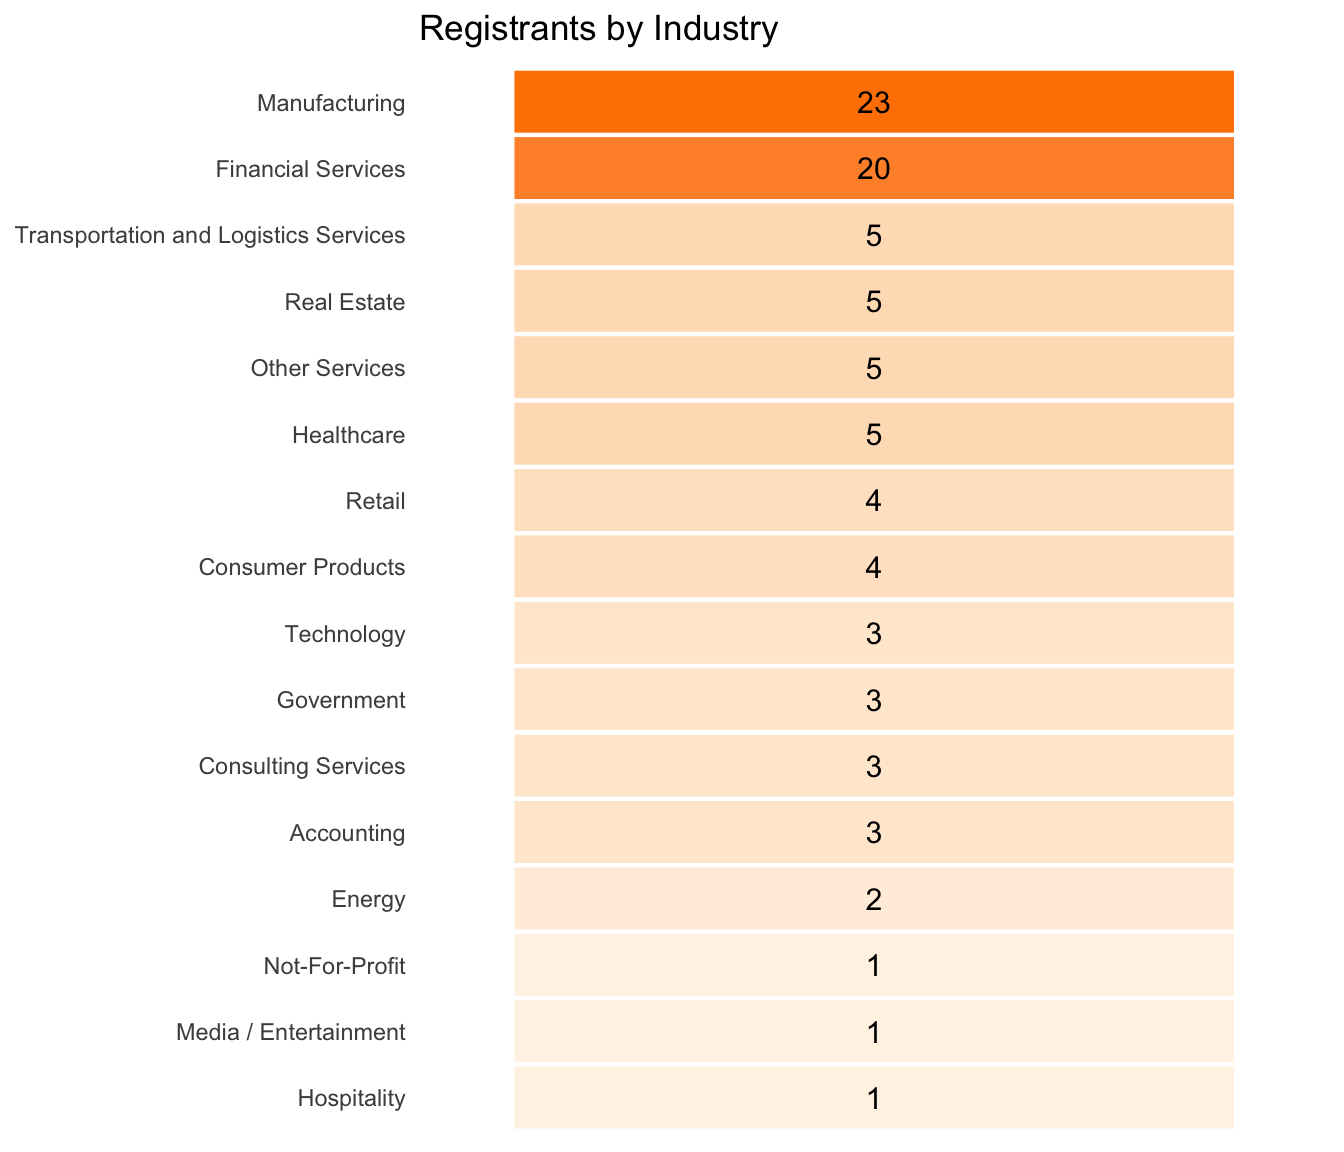
Manufacturing accounted for the largest share of registrations, with 23 registrants (26.1%) representing 14 employers, followed by Financial Services with 20 registrants (22.7%) representing 12 employers. Combined, these two industries accounted for 43 of the 88 guest registrants (48.9%) and 26 of the 68 represented employers (38.2%).
The remaining 45 registrants (51.1%) were distributed across 14 industries, with no individual industry accounting for more than five registrations. Healthcare, Real Estate, Other Services, and Transportation and Logistics Services each contributed five registrants (5.7%), followed by Retail and Consumer Products with four each (4.5%).
5 Faculty Registration
5.1 Faculty Event Registration
| Name | Position | Event Selection |
|---|---|---|
| Debby Powell | Senior Director Regional Development | Both |
| Jill Ogle | Director of Development | Both |
| Arun Bedi | Director Corp Relations | Both |
| Adam O’dell | Director of Career Management for Graduate & Executive Education | Both |
| Phil Drendall | Director of Admissions & Recruitment | Both |
| Amy Cathey | Associate Dean, Graduate and Executive Education | Both |
| Christie Knapper | NA | Both |
| Kate Atchley | NA | Both |
| Ashley Slimp | Assistant Director of Business Development | Both |
| Molly Kinard | Director | Both |
| Kendra Rains | Program Manager- oMBA | Both |
| Bukky Abdul | Assistant Director, SCM Career Management | Both |
| Julie Ferrara | Assistant Department Head | Both |
| Max Davenport | Manager of Alumni & Business Development | Both |
| Taylor Ward | Employer Relations Manager | Both |
| Rachel Oblon | Student Engagement and Career Coordinator | Both |
| Colbe Wilson | Special Programs Manager | Both |
| Cole Burns | Director, Student Development & Career Management | Both |
| Tara Allendorfer | Director, Alumni Relations | Both |
All 19 faculty and staff registrants selected both the Leadership Fireside Chat and Haslam Networking Reception.
Document ID: 2d49a132